
This article talks about on how to capture and analyze fiddler-trace
Fiddler
This helps you debug web applications by capturing network traffic between the Internet and test computers. The tool enables you to inspect incoming and outgoing data to monitor and modify requests and responses before the browser receives them.
Let’s do it step by step
first install app here is the link : https://www.telerik.com/fiddler
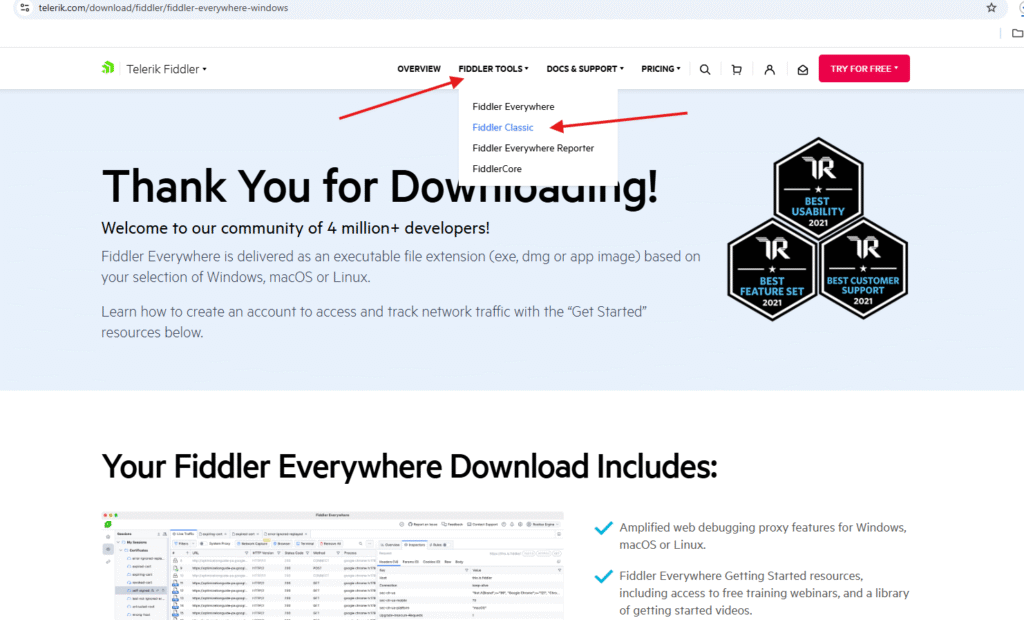
Under fiddler-tools –> select fiddler-classic –> download it –> it will we be saved in downloads folder
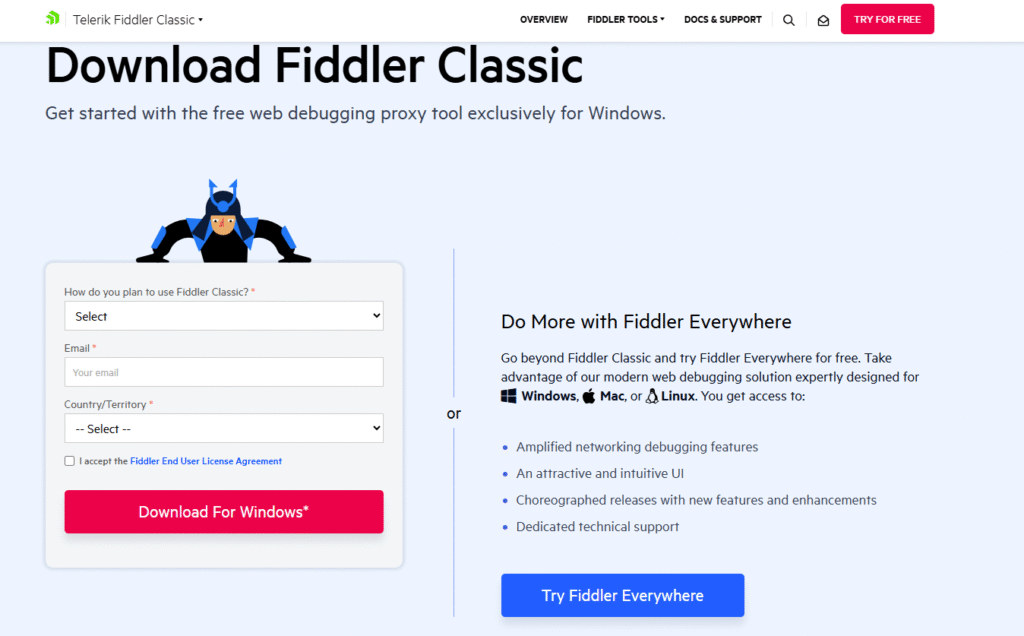
fill in the details
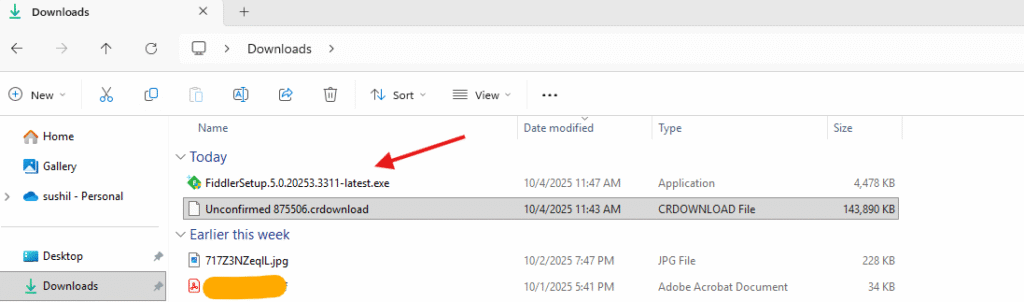
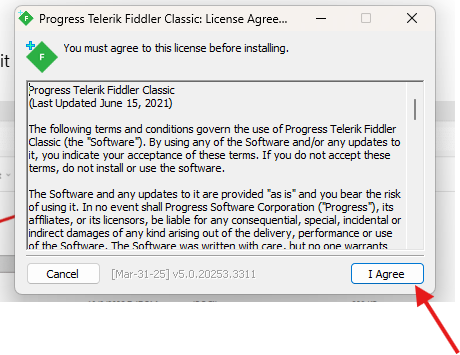
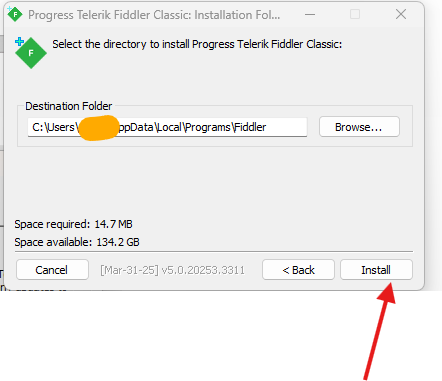
double click on .exe file and start installing it
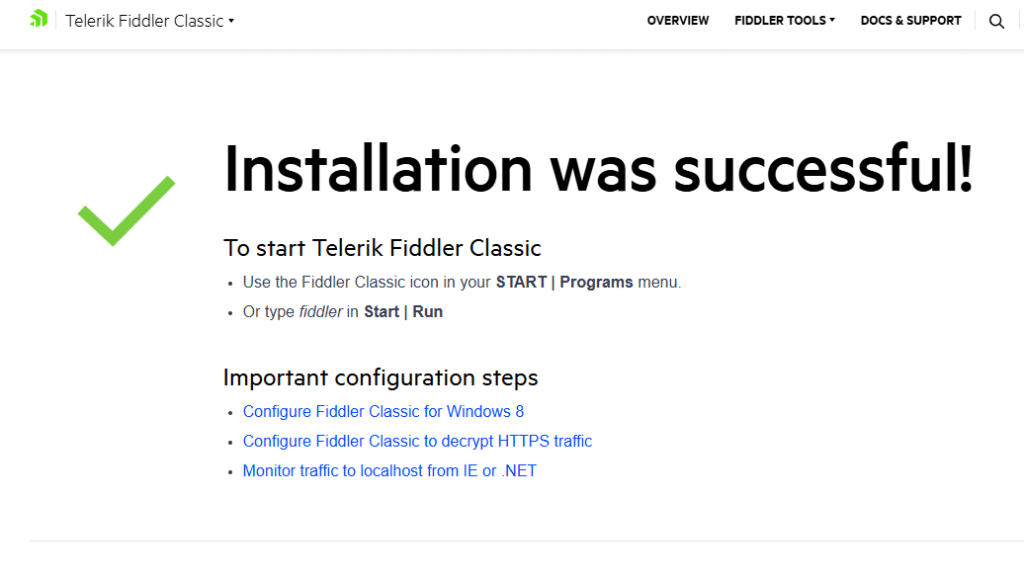
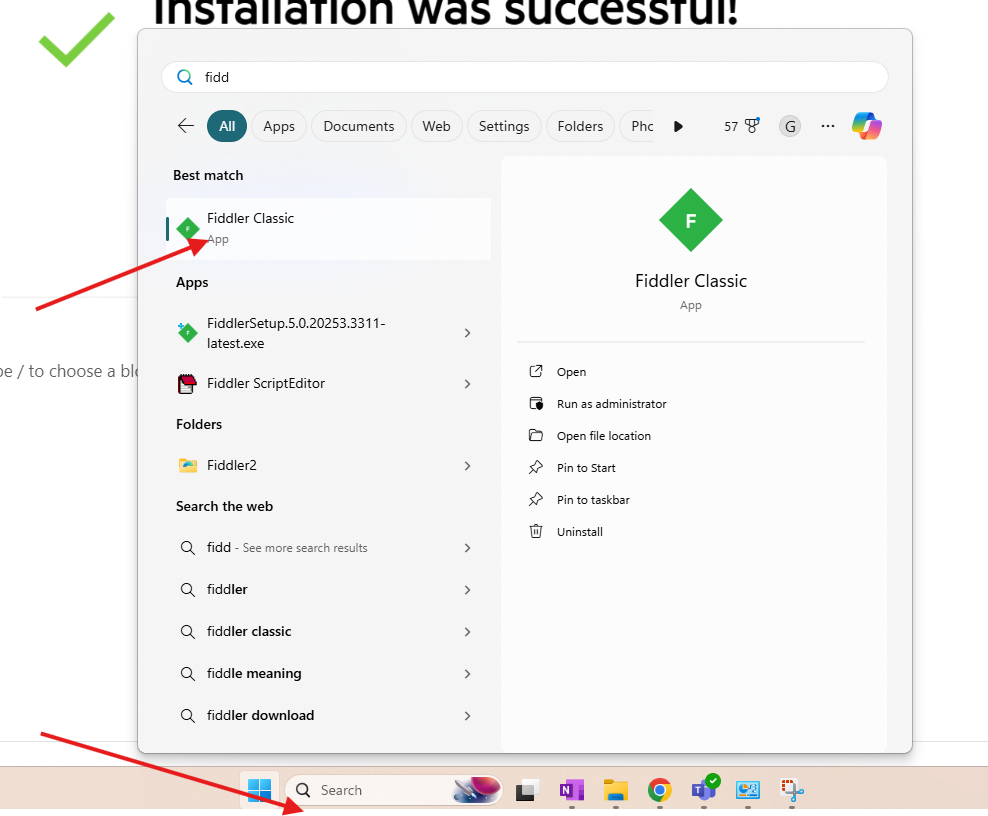
look for app in windows search and launch it
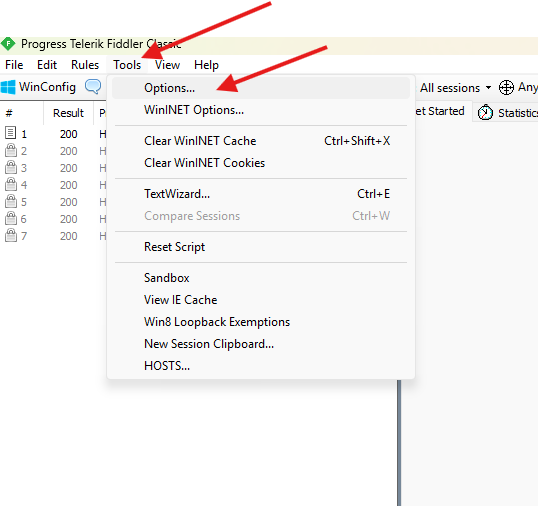
Now click on tools and options
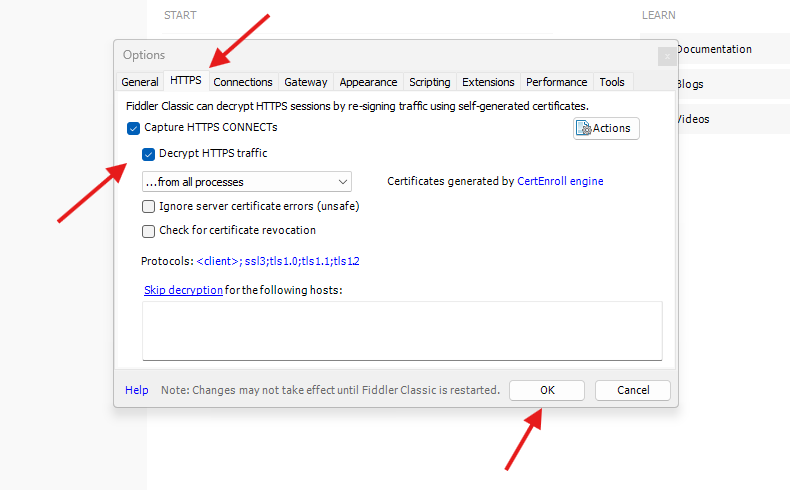
Go to Https tab –> select decrypt HTTPS traffic –> Ok
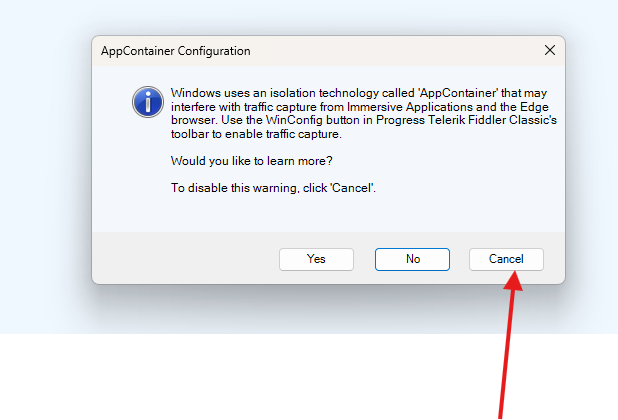
If you get a pop up for fiddler-certificate –> then accept it –> it will bypass proxy if you have it.
Now hit F12 and stop capturing the traffic
Now get ready to start reproducing the issue to collect the logs
e.g. I will launch Teams app in the background it will capture the traffic and I will show you how to check the traffic and find the root cause of the issue.
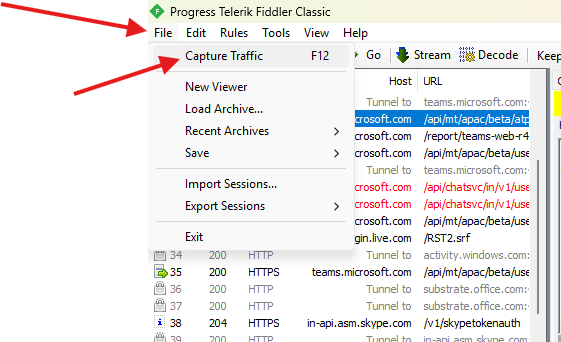
Now again hit F12 in fiddler-app or go to file and click on capture traffic
it will start capturing the logs, make sure to close un-necessary apps
once issue is reproduced and logs are collected in fiddler-app then again hit F12 it will stop capturing the trace.
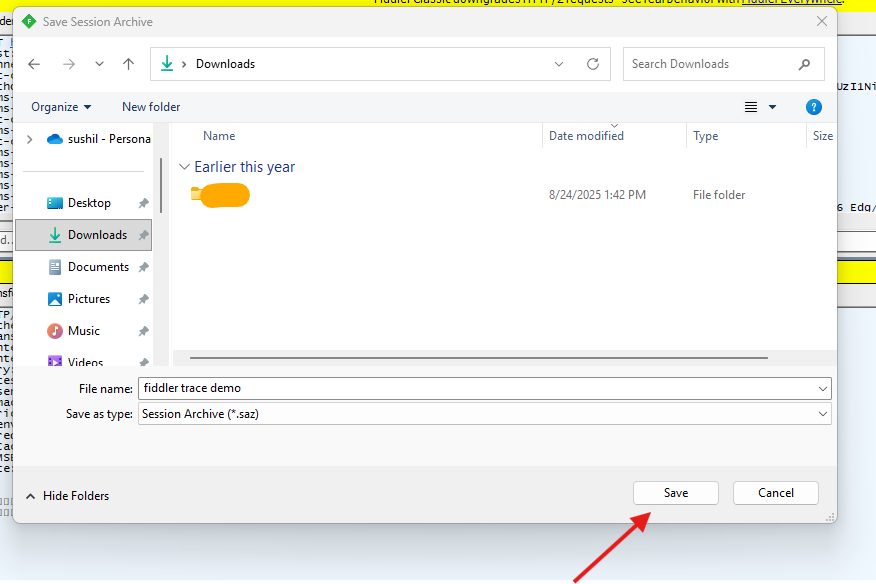
first save it carefully
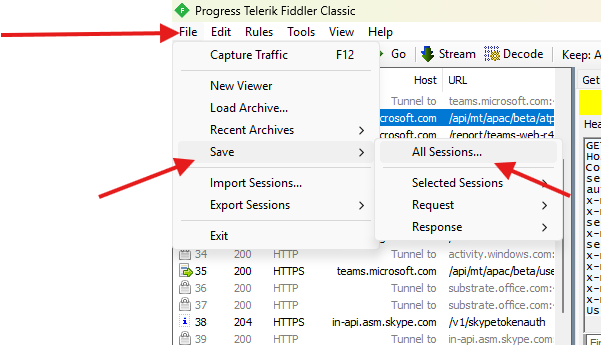
Now in the left hand side–> start looking for the errors associated with the apps in which you faced the issue ( I will check Teams app trace as I was demonstrating the issue in Teams app )
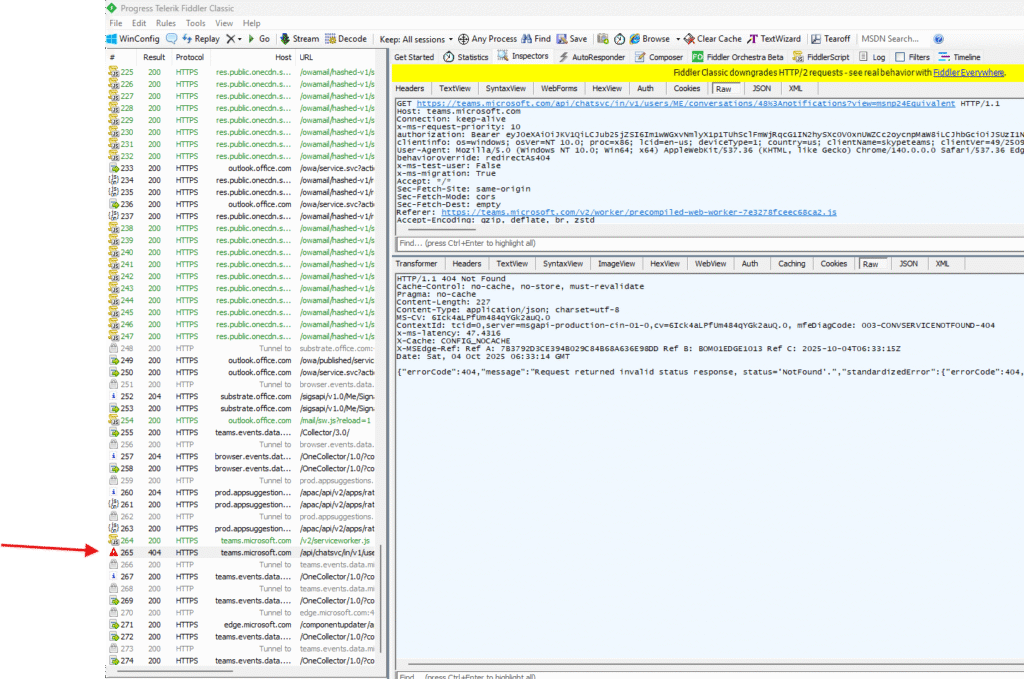
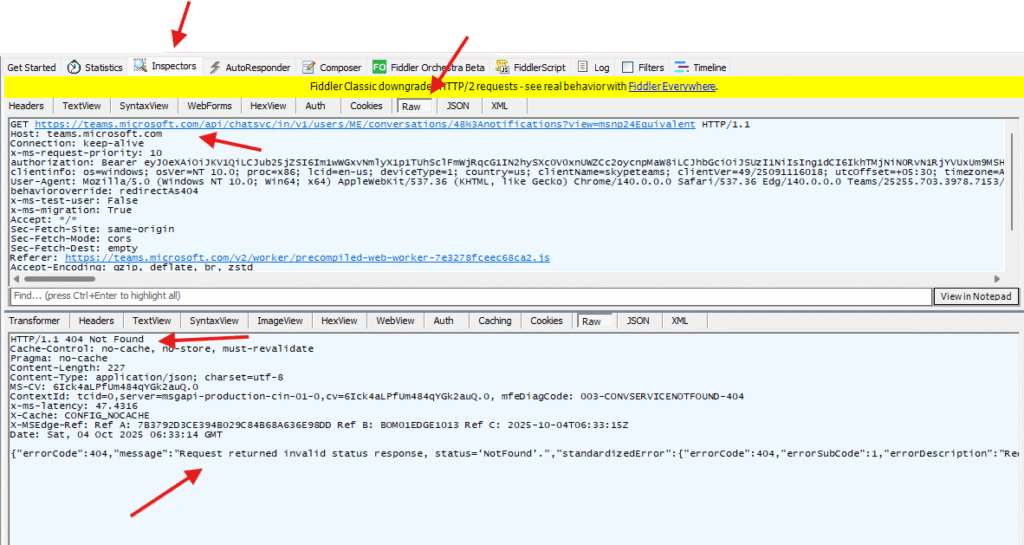
Now locate the error trace from left hand side –> click on it –> on right hand side –> click on inspector –> under it select RAW –> upper trace is the request while below trace is the response for it
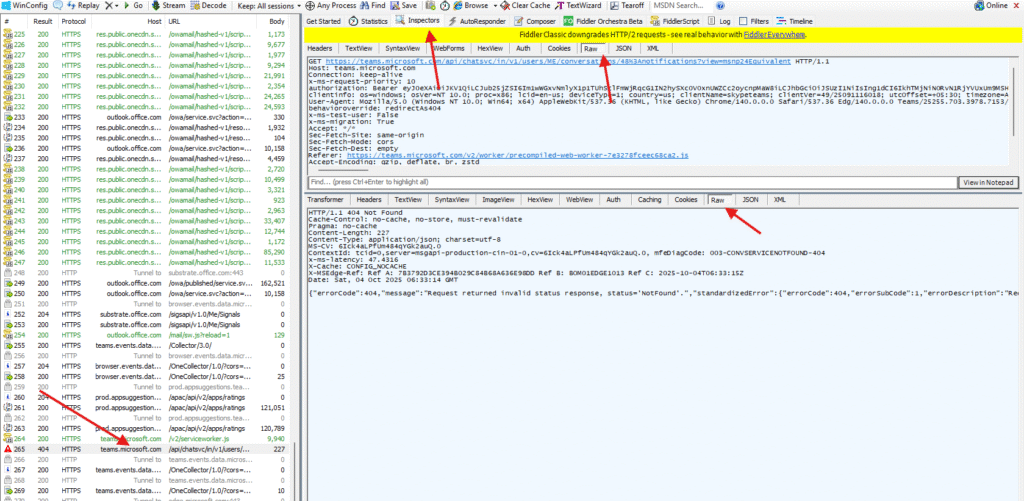
let’s examine it –> in my example I got 404 not found for Teams chat svc –> which is obvious, as in my test Teams account I did not received or sent a chat messages to the end users
That’s how you can capture, save and analyze the traffic.
If you are not able to isolate the issue on your own I would request you to open a ticket with that support in my example I will open ticket with Microsoft by following this article https://microbrother.com/how-to-open-support-ticket-in-o365/
Conclusion:
Post reading above article reader will be able to collect and analyze the fiddler-trace.
Thank you ☺️