This article talks about how to collect and analyze HAR logs in web browser
HAR logs :
HAR logs, or HTTP Archive logs, are a JSON-formatted file that records all network activity between a web browser and a website. These logs detail network requests and responses, including headers and timings, which are crucial for web developers and support teams to troubleshoot and diagnose issues such as slow loading times, broken features, and rendering problems
Let’s capture it step by step :
open browser
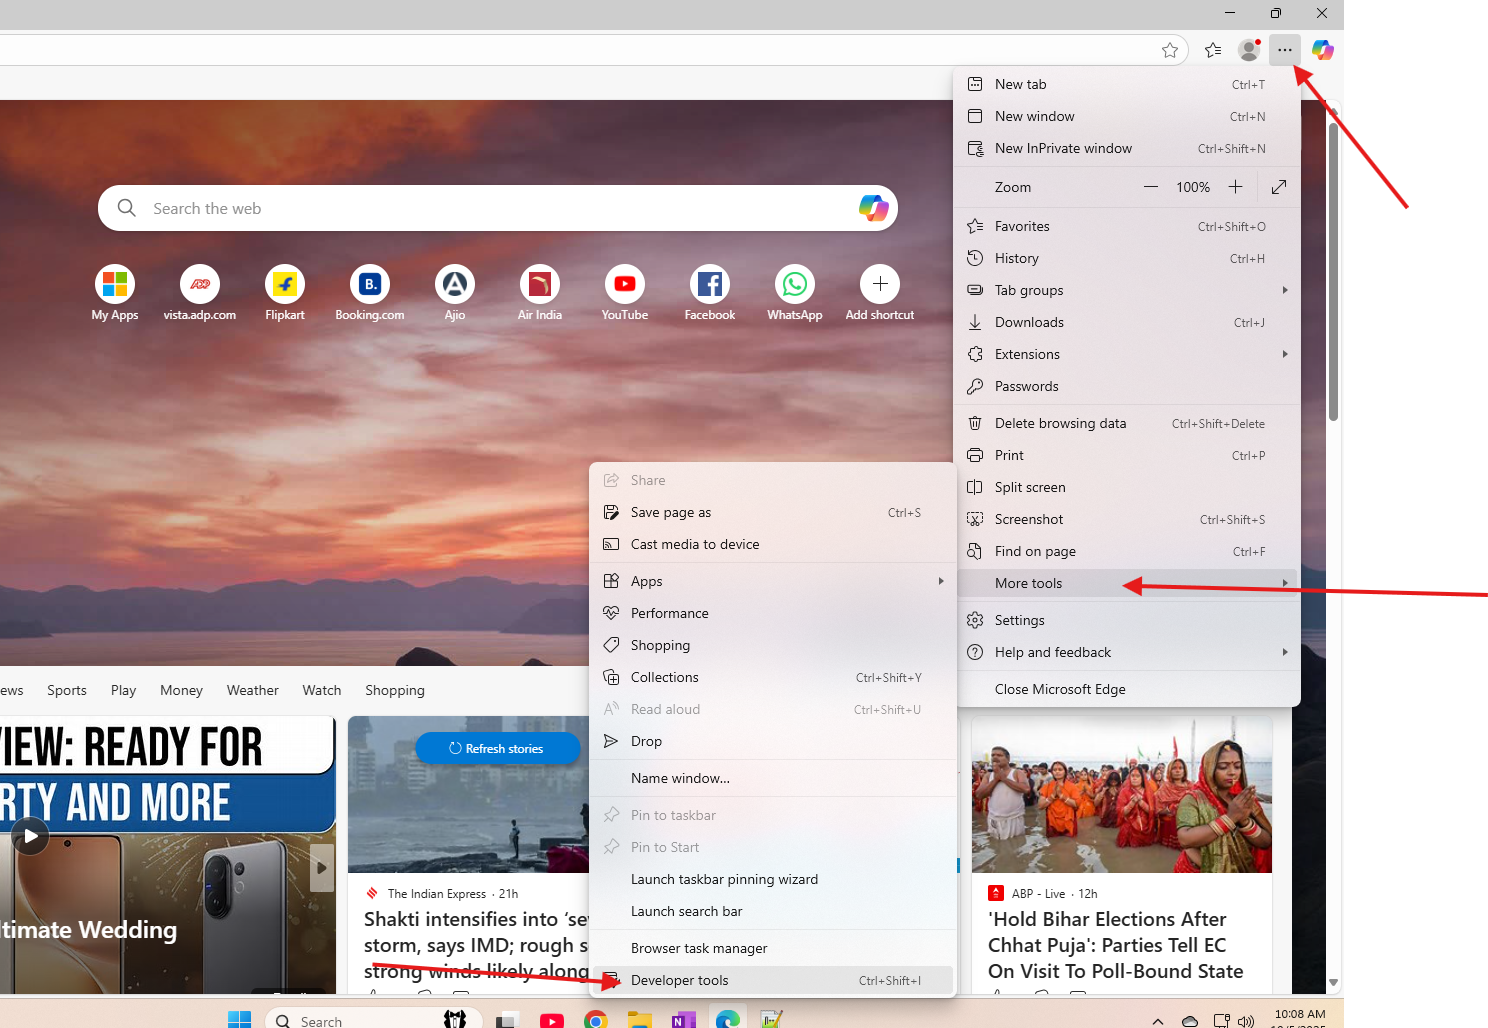
Open developer tools ( see in below snippet)
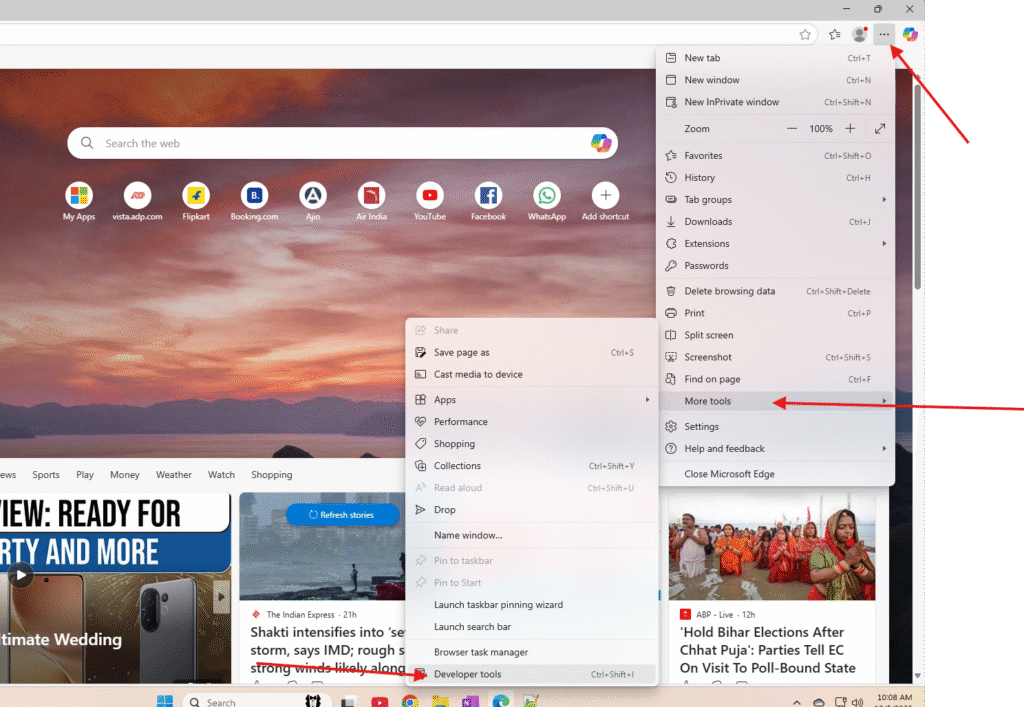
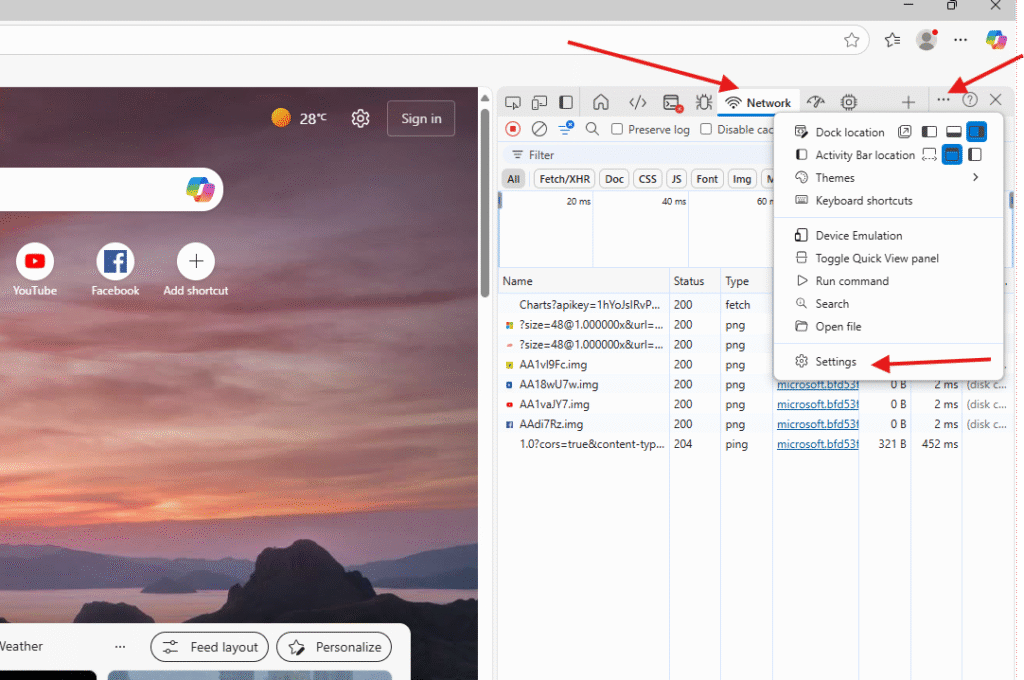
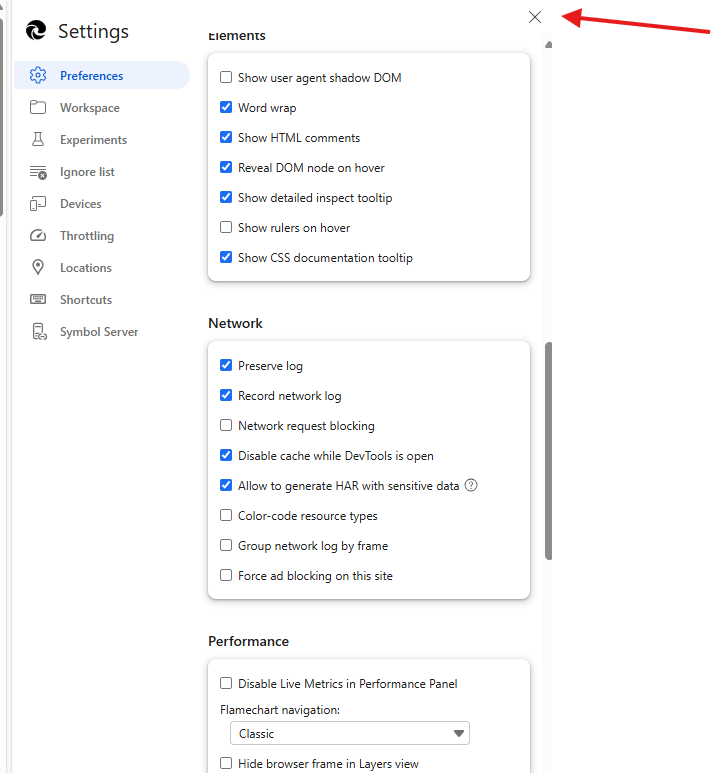
Go to Network tabs –> open settings
Under network section please put a tick for below options
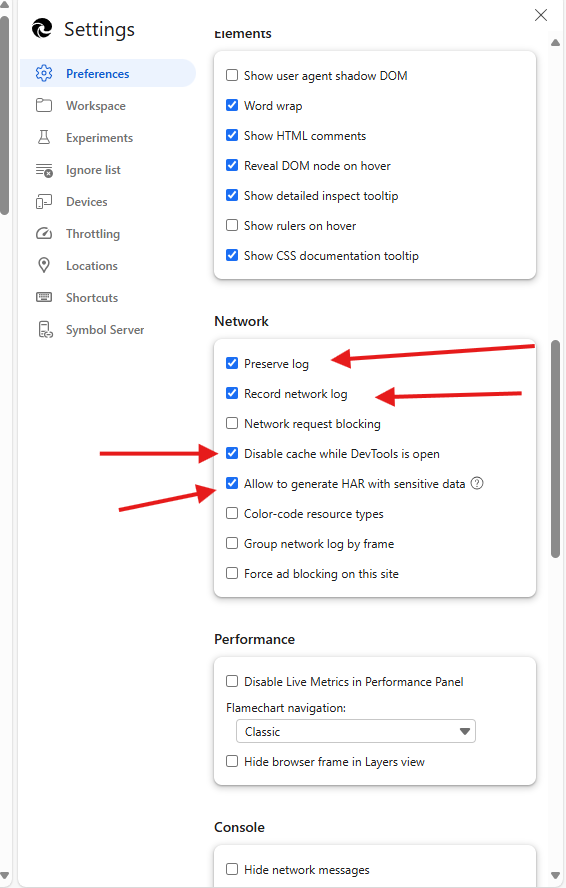
Now tool is ready –> close it
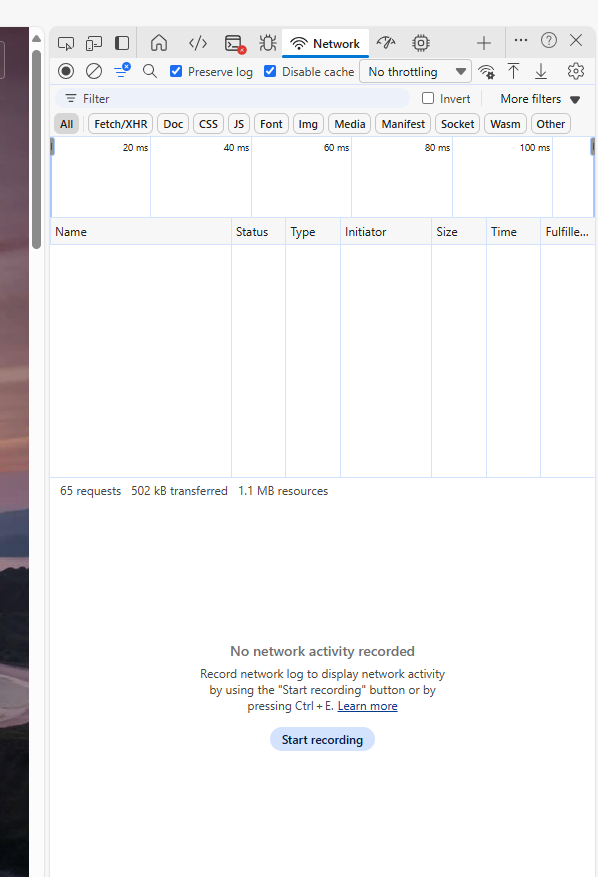
Now stop capture and clear old logs
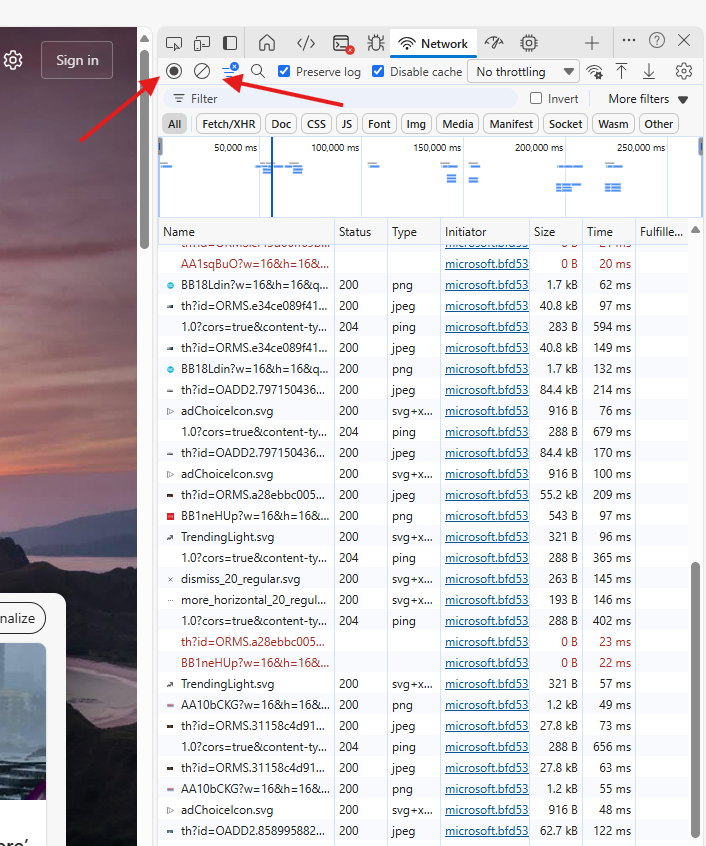
Now it’s ready
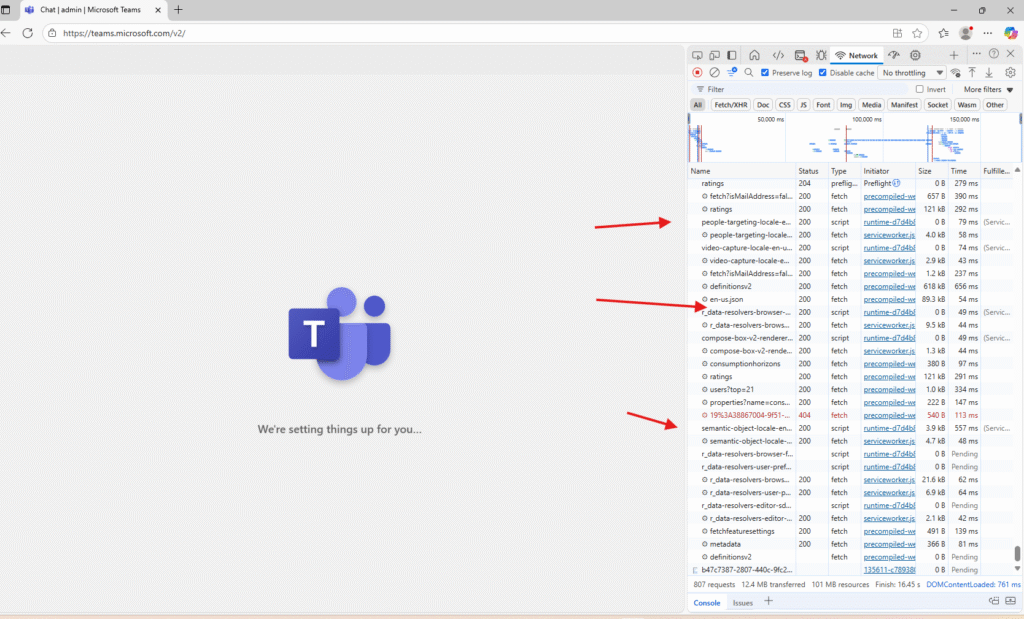
Now start reproducing the issue –> for an example I will launch Teams in web browser
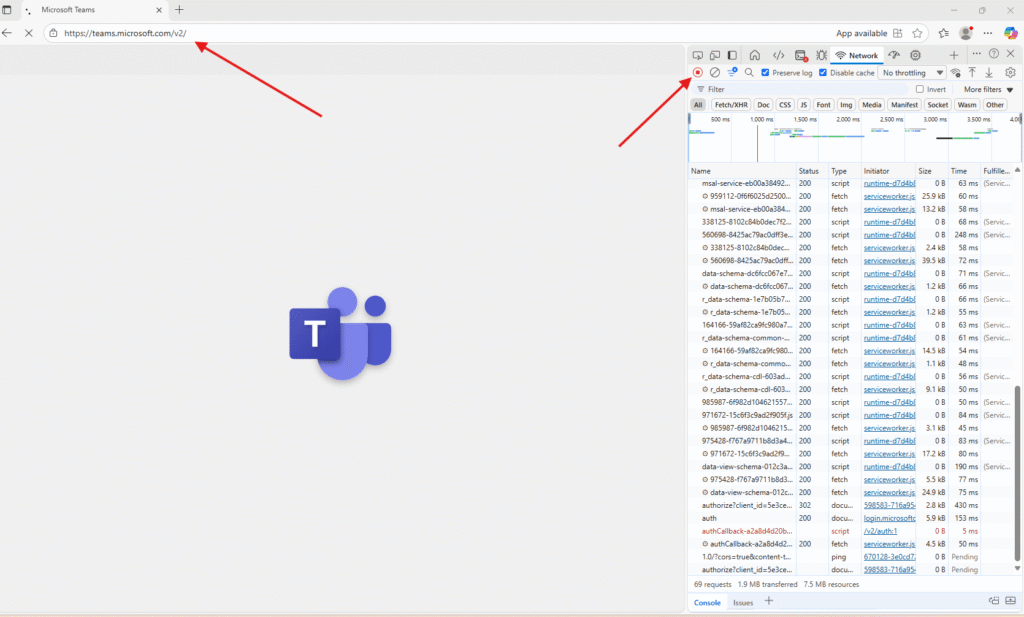
In the background it will continue to capture the logs
For a demo I will send message to internal user
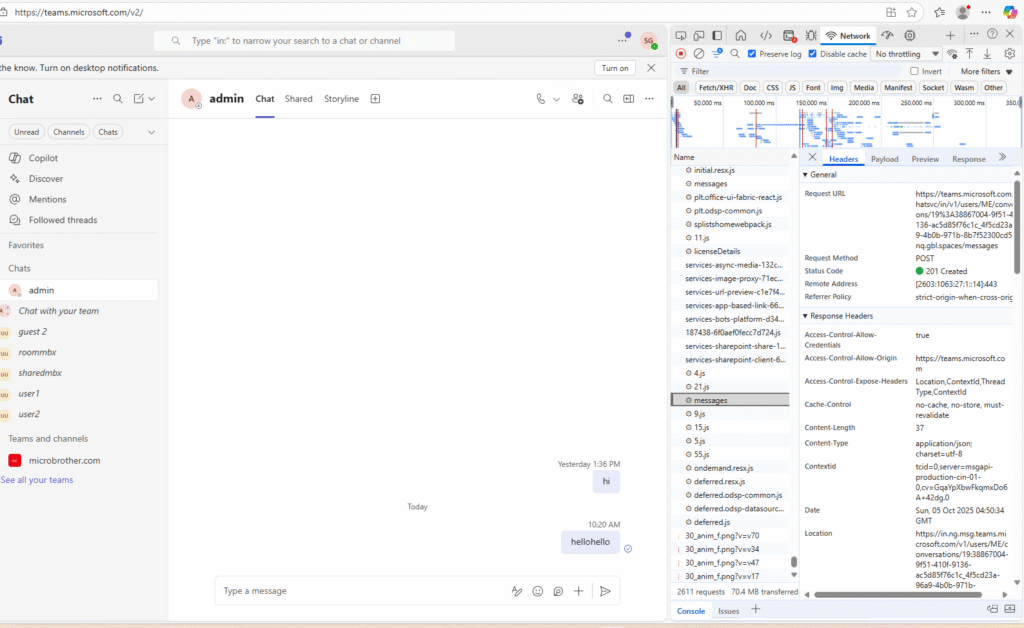
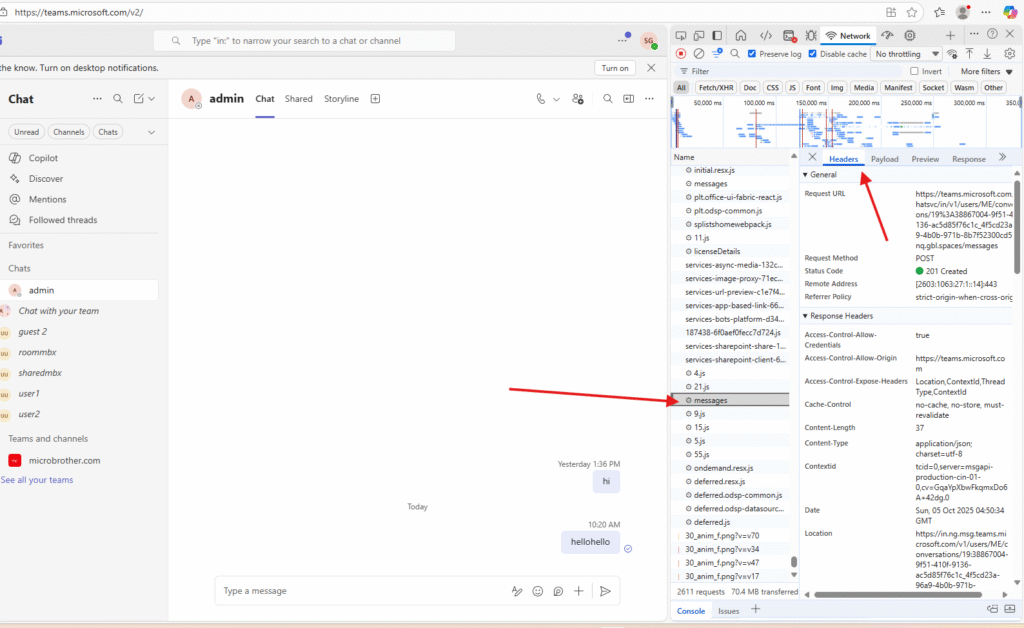
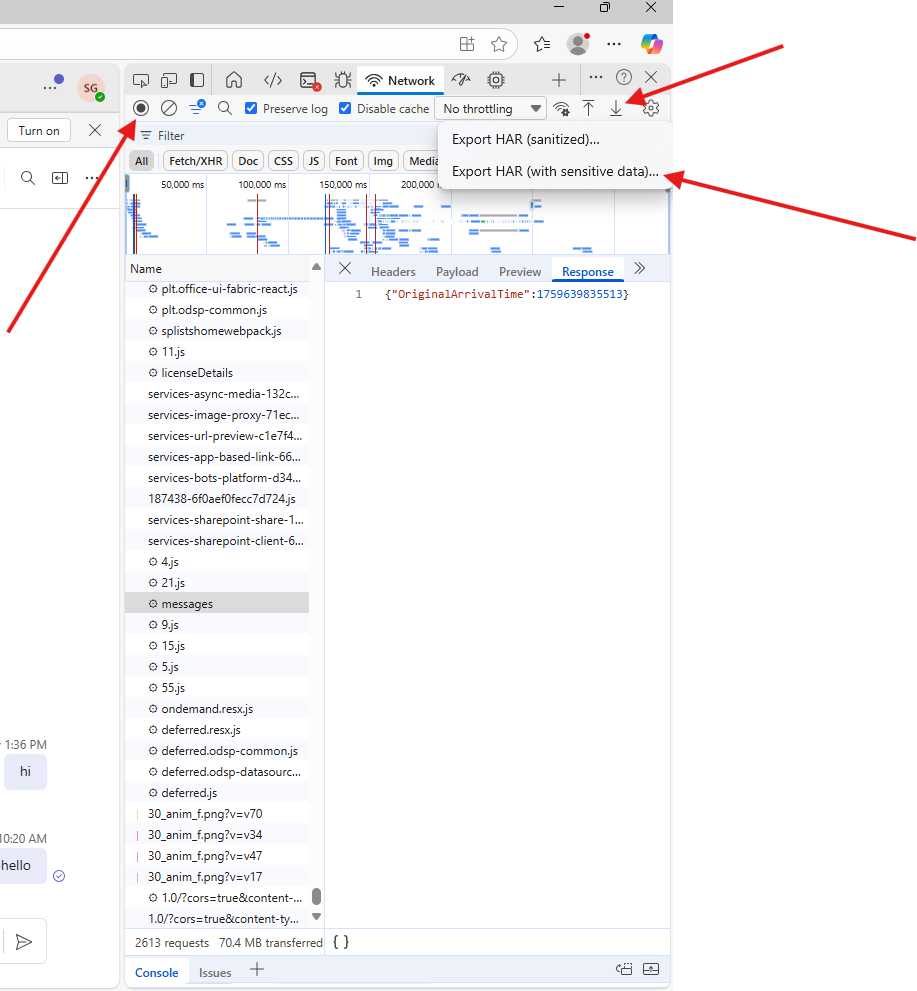
In the header section we can see the request
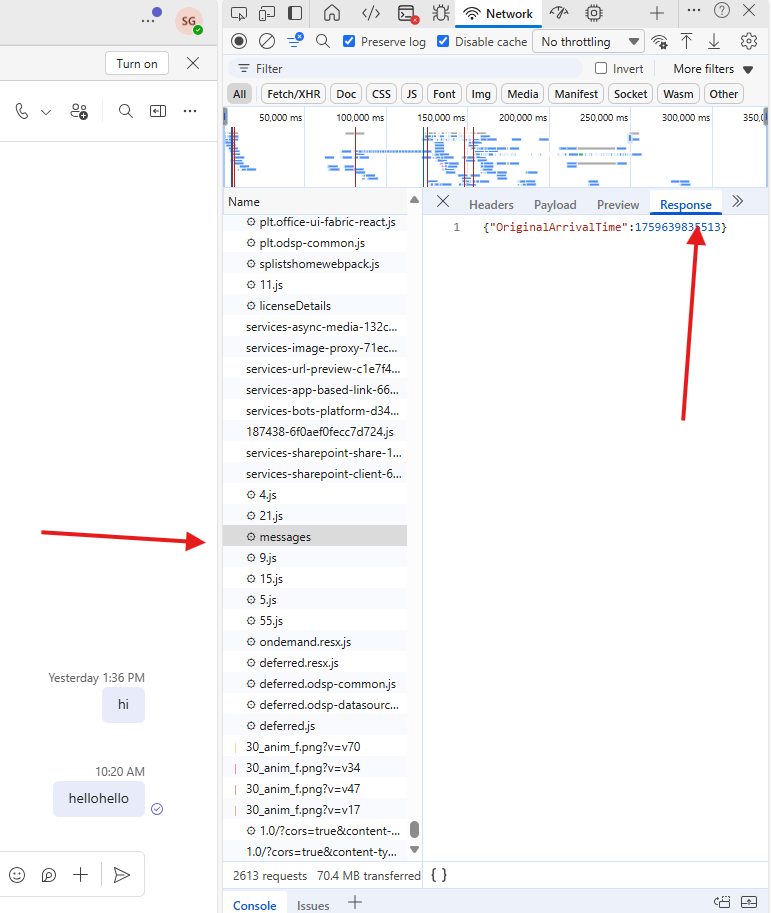
in the response section I will be able to the response wrt to the header
Now stop the logs and download them carefully
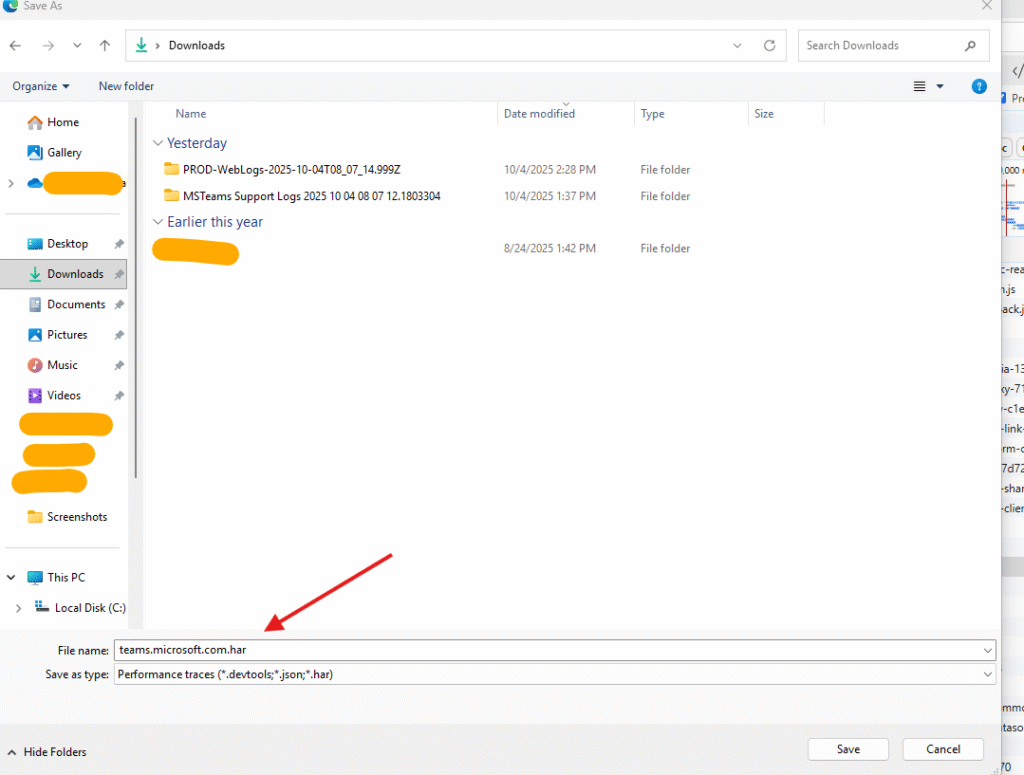
Click on export HAR –> and save them with second option viz Export HAR with sensitive data
save it with the suggested name only
You can open it using notepad ++ https://notepad-plus-plus.org/ or again open browser go to the developer option –> now click on import HAR and select the saved logs –> open them and start analyzing them.
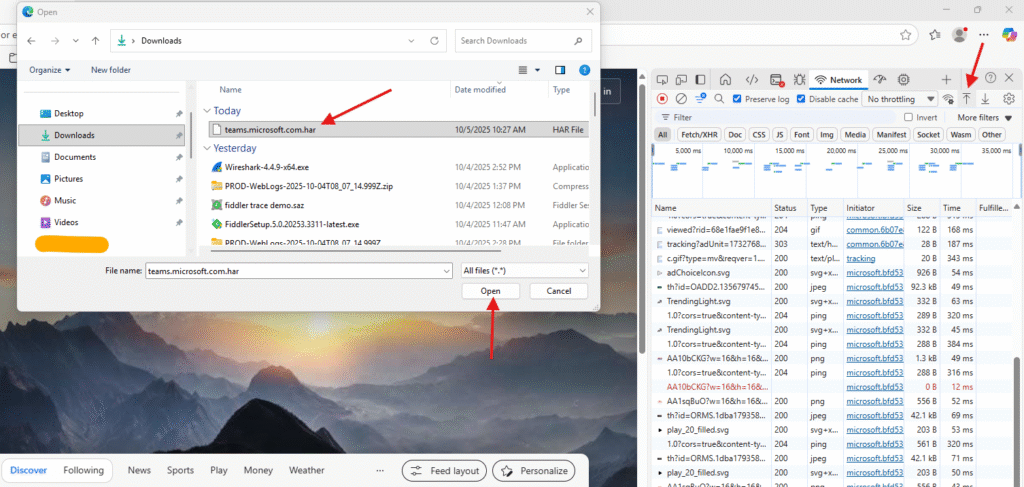
click on the traffic where you see error or relevant data then check the header and response sections for it.
Take necessary actions as per the error
Conclusion :
Post reading above article reader will be able to collect and analyze HAR logs in web browser.
Also you can read this article https://microbrother.com/wireshark-logs-how-to-capture-and-analyze-them/ to collect the Wireshark logs
Thank you ☺️