
This article talks about on how to view Microsoft call quality dashboard in Power Bi app
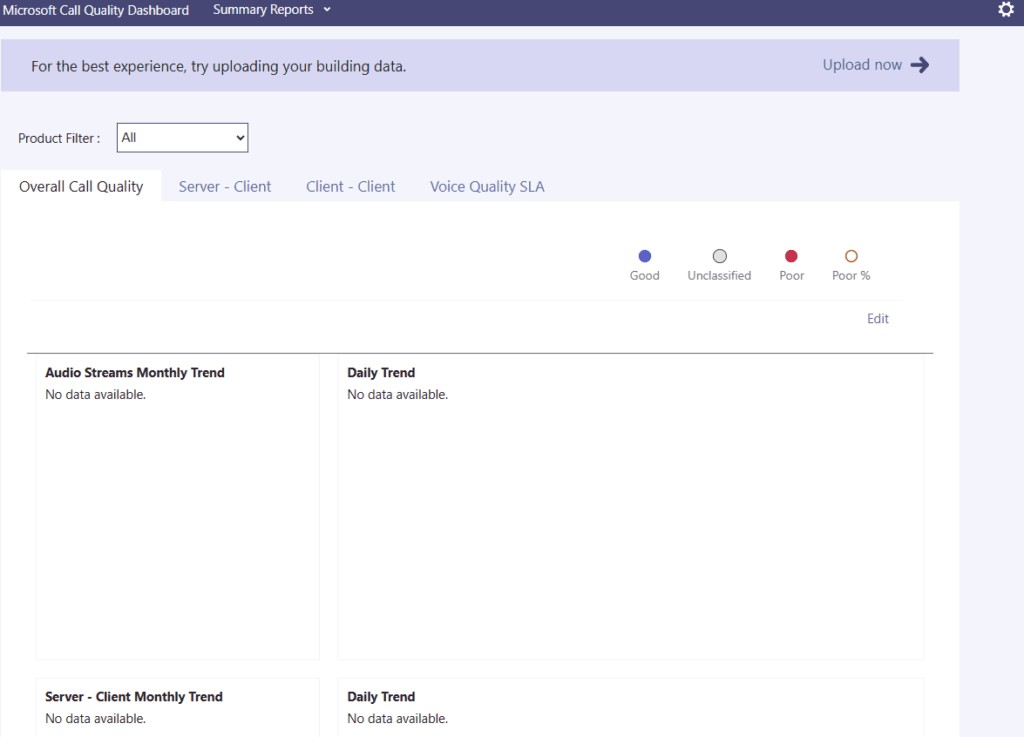
Call quality dashboard
Power Bi + CQD in MS Teams is a powerful, integrated analytics solution used to monitor, visualize, and troubleshoot audio/video quality and reliability issues across an organization.
It combines CQD’s near-real-time streaming data with Power BI’s interactive reporting, enabling admins to identify network, building, or user-level issues
Call Quality Dashboard → Power BI Dataset → Power BI Report → Power BI App
Below is the complete end-to-end step-by-step procedure (Admin + Power BI deployment)
PHASE 1: PREREQUISITES (Must Check First)
1. Required Permissions
You must have at least one of these roles:
- Teams Administrator
- Global Administrator
- CQD Administrator / CQD Reader (recommended)
- Power BI Admin (optional but helpful)
To verify call quality dashboard access:
Go to:
Teams Admin Center → Analytics & reports → Call Quality Dashboard
If CQD opens, you are good :https://cqd.teams.cloud.microsoft/spd/#/Dashboard/
2. call quality dashboard Must Be Enabled (CQD Data Available)
call quality dashboard data is available only after:
- Users are making Teams calls
- Data is collected for at least 24–48 hours
3. Power BI Licensing Requirement
To publish & share Power BI App, you need:
Option A (Most common)
Power BI Pro license for:
- Report creator
- All users consuming the App
Option B (Enterprise)
Power BI Premium capacity (then free users can consume)
PHASE 2: GET CQD DATA INTO POWER BI
There are 2 ways:
Recommended Way: Use call quality dashboard OData API (Automatic refresh)
Step 1: Get CQD OData URL
Use this call quality dashboard API endpoint: https://cqd.teams.microsoft.com/spd/odata/v1.0/
This is the most common endpoint used globally.
Step 2: Open Power BI Desktop
- Open Power BI Desktop
- Click Home → Get Data
- Search and select OData Feed
- Paste: https://cqd.teams.microsoft.com/spd/odata/v1.0/
- Click OK
Step 3: Authenticate
When prompted:
- Select Organizational account
- Click Sign in
- Sign in with your Teams admin account
- Click Connect
Step 4: Select CQD Tables
Navigator will show many tables.
Select these minimum recommended tables:
Core Fact Tables
- AudioStreams
- VideoStreams
- AppSharingStreams
Dimensions
- Building
- Subnet
- Tenant
- ConnectionType
- ISP
- Device
Then click:
Transform Data (recommended)
Step 5: Power Query Cleanup (Mandatory)
In Power Query:
Recommended cleanup actions
- Keep only required columns (remove unnecessary ones)
- Filter last 30 / 90 days to improve performance
Example filter:
- StartTime >= DateTime.LocalNow() – 90 days
Step 6: Load Data
Click:
Close & Apply
Now data will load into your PBIX model.
PHASE 3: CREATE YOUR POWER BI REPORT (CQD STYLE)
Step 7: Create Date Table
Go to Modeling → New Table
Date = CALENDAR ( MIN(AudioStreams[StartTime]), MAX(AudioStreams[StartTime]) )
Add columns:
MonthYear = FORMAT(Date[Date], “MMM yyyy”)
Year = YEAR(Date[Date])
Month = FORMAT(Date[Date], “MMM”)
Week = WEEKNUM(Date[Date])
Step 8: Create Relationships
Go to Model view and create relationships:
AudioStreams relationships
- AudioStreams[BuildingId] → Building[BuildingId]
- AudioStreams[SubnetId] → Subnet[SubnetId]
- AudioStreams[DeviceId] → Device[DeviceId]
- AudioStreams[ISPId] → ISP[ISPId]
- AudioStreams[ConnectionTypeId] → ConnectionType[ConnectionTypeId]
- AudioStreams[StartTime] → Date[Date]
Do the same for VideoStreams.
Step 9: Create Core Measures
Create measures:
Total Streams = SUM(AudioStreams[TotalStreamCount]) + SUM(VideoStreams[TotalStreamCount])
Total Poor Streams = SUM(AudioStreams[PoorStreamCount]) + SUM(VideoStreams[PoorStreamCount])
Overall Poor Rate % = DIVIDE([Total Poor Streams], [Total Streams], 0)
Avg Packet Loss % = AVERAGE(AudioStreams[AveragePacketLossRate])
Avg Jitter = AVERAGE(AudioStreams[AverageJitter])
Avg RTT = AVERAGE(AudioStreams[AverageRoundTrip])
Avg MOS = AVERAGE(AudioStreams[AverageNetworkMOS])
Step 10: Build Pages (Suggested Minimum)
Create these report pages:
Page 1: Executive Summary
- KPI Cards
- Poor rate trend line
- Top 10 bad buildings
- Top 10 bad subnets
- Connection type pie chart
Page 2: Network Analysis
- Subnet matrix (Building → Subnet)
- Scatter plot (Packet Loss vs Jitter)
Page 3: Building Analysis
- Select building slicer
- Poor rate trend
- Subnet performance chart
Page 4: ISP Analysis
- ISP wise poor rate %
- ISP wise RTT
Page 5: Device Analysis
- Worst devices by poor rate
Step 11: Save PBIX
Save as:
Teams_CQD_Dashboard.pbix
PHASE 4: PUBLISH REPORT TO POWER BI SERVICE
Step 12: Create a Workspace
Go to Power BI Service:
https://app.powerbi.com
- Click Workspaces
- Click New workspace
- Name it:
Teams CQD Analytics - Set privacy: Private
- Create
Step 13: Publish PBIX
In Power BI Desktop:
- Click Publish
- Select workspace: Teams CQD Analytics
- Publish
PHASE 5: CONFIGURE DATA REFRESH (MOST IMPORTANT)
CQD reports must refresh automatically.
Step 14: Configure Dataset Credentials
In Power BI Service:
- Go to workspace
- Click Datasets
- Click your dataset → Settings
- Under Data source credentials
- Click Edit credentials
- Choose:
- Authentication method: OAuth2
- Sign in with your admin account
Step 15: Configure Scheduled Refresh
In Dataset settings:
- Enable Scheduled Refresh
- Choose refresh frequency:
- 2–4 times/day is common
- Select time zone
- Apply
PHASE 6: CREATE POWER BI APP (WHAT YOU WANT)
Now your report is ready to be deployed as an App.
Step 16: Create App
In your Workspace:
- Click Create → App
- App name:
Microsoft Teams CQD Dashboard - Description:
“Teams call quality dashboard powered by CQD data” - Add logo (optional)
Step 17: Add Content to App
Under App content:
- Include the report
- Include dashboard (optional)
Select the report pages you want.
Step 18: Set Audience / Access
Add users/groups:
Recommended:
- Teams Admin group
- Network team
- IT support group
They must have Power BI Pro unless you have Premium.
Step 19: Publish the App
Click:
Publish App
Now you get an App link.
Users will see it in:
Power BI → Apps → Microsoft Teams CQD Dashboard
PHASE 7: SECURITY & ACCESS CONTROL (Important for Enterprises)
Step 20: Workspace Permissions
Give access to workspace carefully:
Best practice
- Only report creators = Member/Contributor
- Normal users should only access App (Viewer)
PHASE 8: OPTIONAL (RECOMMENDED ENHANCEMENTS)
A) Create Row Level Security (RLS)
Example: allow regional IT teams to see only their buildings.
- Region Team A → only Building A/B/C
- Region Team B → only Building X/Y/Z
This is optional.
B) Use Power BI Dataflow (Better Performance)
Instead of loading CQD directly in PBIX:
CQD OData → Dataflow → Dataset → Report → App
This is more stable for large tenants.
C) Use Incremental Refresh (Very Useful)
If your tenant has high call volume, CQD tables become huge.
Use incremental refresh:
- Store 1 year
- Refresh last 30 days only
IMPORTANT LIMITATIONS YOU SHOULD KNOW
- CQD OData is not as fast as SQL databases.
- Large tenants may hit refresh failures unless you filter.
- Some CQD tables are aggregated, not call-by-call raw data.
- Do not pull all history (will kill performance).
Best practice: Last 90 days only.
Conclusion
Post reading above article user will be able to view Microsoft call quality dashboard in Power Bi app
Also you can read https://microbrother.com/how-to-create-policy-packages-in-ms-teams/ this article to create policy packages in MS Teams
Thank you 😇